Data platform
A warehouse or lakehouse with a catalog and lineage, so people know where each number comes from and who owns it.

Data engineering
Bluelupin builds data platforms and dashboards that pull numbers from your ERP, CRM, HR and other systems into one trusted place. We design the warehouse or lakehouse, build the pipelines that load and check the data, and create BI dashboards for leaders and teams. For machine learning and AI systems, see AI Solutions.
As a data analytics company in India working with teams in India and abroad, we build three things that work together: a place to keep the data, pipelines that fill it, and dashboards that people use every day.
A warehouse or lakehouse with a catalog and lineage, so people know where each number comes from and who owns it.
Data loaded from your systems on a schedule or as it changes, with checks at each step before it reaches a report.
KPI scorecards and reports for operations, finance and leadership, on desktop and mobile.
Data warehouse development starts with one choice: where the data lives and how it is queried. We recommend the design based on your data volume, your query patterns and your team's skills.
Structured data from your business systems, modeled for fast reporting. We build warehouses on Redshift or BigQuery.
Large or mixed data, such as files, logs and exports, stored at low cost in S3 and queried with Athena when needed.
Both in one design: cheap storage for raw data and warehouse tables for reporting, often on AWS.
Data pipeline development is most of the work on a data project. A report is only as good as the data that feeds it, so every pipeline we build checks the data as it moves.
We bring data in from source systems by API, change data capture (CDC) or batch ETL, orchestrate the runs with Airflow or AWS Step Functions and write the transformations in dbt. Where numbers are needed in real time, we use streaming or event pipelines.
Validation rules catch bad records, anomaly alerts flag unusual totals, and reconciliation checks compare each load against the source system. Data contracts and shared master data mean a change upstream cannot silently break a report.
We connect the systems your teams already run and bring their data into one analytics layer. When you only need two systems to exchange data, with no reporting on top, see API and Integration Services.
BI dashboard development is where the data reaches people. We build dashboards in the BI tool you already use, such as Power BI or Amazon QuickSight, or as a custom dashboard in your app.
The few numbers leadership reviews each week, with the trend and the source behind each one.
Daily figures for the teams that run the work, on desktop and mobile.
Charts and reports inside your own web app or portal, so users do not switch tools.
Business users explore the data and build their own views, without a ticket for every report.
Clean, documented data is the first step for any AI project. When you want AI built on your data, such as agents, search or document processing, our AI Solutions team takes it from there.
| You need | Use |
|---|---|
| Warehouses, pipelines, BI dashboards | Data Engineering and Analytics (this page) |
| Machine learning, predictive models, AI systems | AI Solutions |
| Moving data during an ERP change | ERP Development and Modernization |
| One-off system connections | API and Integration Services |
Every data project follows the same five steps, so you agree the questions and the quality rules before anything is built.
The questions the business needs answered, the systems that hold the data and the people who own each source.
The platform, the data models and the quality rules, reviewed with the people who will use the reports.
The pipelines and the first dashboards, tested against numbers your teams already know.
Handover to your team with documentation, and training for the people who use the dashboards.
Changes and new sources as the business grows, by your team or through Application Support and Maintenance.
How long it takes: A focused module usually takes 8 to 12 weeks, and a larger program 4 to 9 months in phased releases.
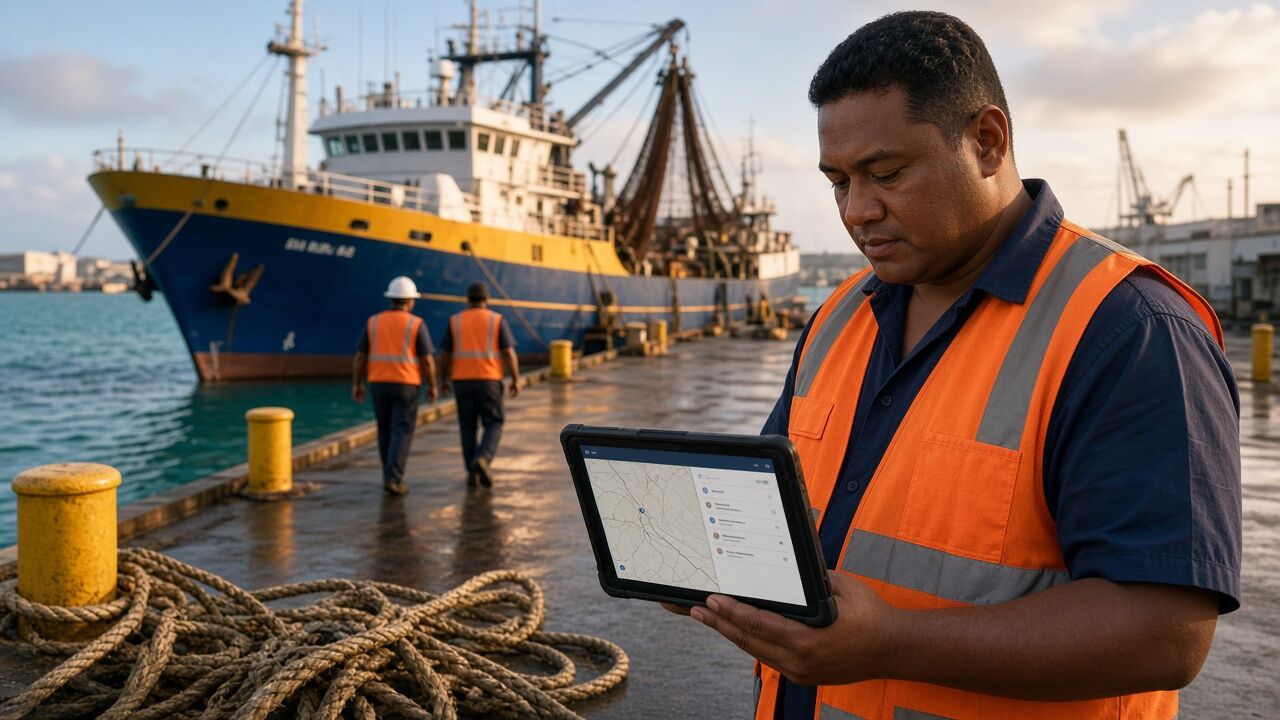
Tri Marine, a global supplier of tuna and tuna products, needed a cloud-based central operations portal to track and report its operations across global supply chains. We built the portal on Microsoft Azure, with real-time dashboards and operational reports, and integrations that connect field teams with the company's enterprise systems.
Common questions about data engineering and analytics.
Both. We recommend the design based on your data volume, query patterns and team skills. Often that is a lakehouse on AWS, for flexibility and cost control.
Yes. We bring in data from your ERP, including ERPNext, CRM tools such as Salesforce, HR systems and custom applications through APIs, change data capture and batch ETL, into one analytics layer.
We use validation rules, anomaly alerts, reconciliation checks and data contracts, so the people who use the reports can trust the numbers.
This page covers data platforms, pipelines and dashboards. When you want AI built on your data, such as agents, search or document processing, see AI Solutions.
We build dashboards in the BI tool your team already uses, or as custom dashboards inside your own web app.
Tell us which numbers your leaders do not trust today. Response within one business day.
Book a consultationOr email sales@bluelupin.com or call +91 99100 24224


